
Debug API Requests and Errors Without DevTools
Automatically detect and group 401, 403, network, client, and authentication issues directly from your browser traffic.
No more digging through noisy DevTools logs — API Error Debugger makes failing requests structured, visible, and easier to understand instantly.
What API Error Debugger does
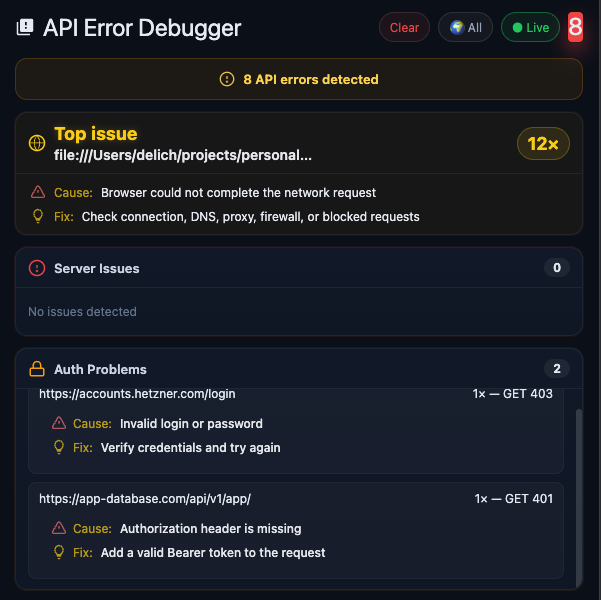
API Error Debugger helps frontend developers, QA engineers, and technical teams debug failing API requests faster. Instead of manually scanning the Network tab, you get grouped request failures, a visible top issue, likely causes, and practical fixes in one place.
It is designed for real browser-side debugging workflows where API calls fail because of invalid credentials, missing headers, blocked requests, expired tokens, client-side mistakes, or network problems.
Common API errors you can spot faster
401 Unauthorized
Quickly detect authentication failures caused by expired tokens, missing Bearer tokens, invalid sessions, or broken login flows.
403 Forbidden
See when requests are rejected because of missing permissions, invalid credentials, blocked access rules, or restricted resources.
Network request failures
Surface browser-side request failures caused by DNS issues, blocked requests, proxy problems, unstable connections, or fetch errors.
Client-side request issues
Find malformed requests, missing headers, bad payloads, incorrect endpoints, and repeated request patterns that are easy to miss in DevTools.
Authentication problems
Spot invalid login credentials, broken auth flows, missing Authorization headers, and token-related request errors directly in Chrome.
Repeated failing patterns
Group duplicate issues so you can immediately see what is failing most often instead of digging through dozens of similar network entries.
Why debugging API requests in DevTools is slow
Chrome DevTools is powerful, but debugging API problems there can be noisy and time-consuming. Errors are buried among successful requests, repeated failures are scattered across the Network tab, and authentication problems often require manual inspection to understand what actually broke.
API Error Debugger reduces that friction. It turns browser traffic into structured issue groups so you can see what failed, why it likely failed, and what to check next.
Who this Chrome extension is for
Frontend developers
Debug browser API calls faster without constantly switching between logs, code, and the Network tab.
QA engineers
Catch failing requests during manual testing and quickly understand whether the issue is auth, network, client-side, or server-related.
Full-stack teams
Speed up debugging when browser requests fail and reduce the time spent guessing what happened in the request chain.
Anyone debugging APIs in Chrome
If you work with API-based products and spend time investigating request failures, this extension is built for you.
How it works
API Error Debugger watches browser traffic, detects failed requests, groups similar errors, highlights the top issue, and gives you a faster path to understanding the root problem.
Instead of manually reviewing every request in DevTools, you get a cleaner debugging view focused on the failures that matter most.
Privacy-first API debugging inside your browser
API Error Debugger is built for fast, practical, browser-side debugging. The focus is simple: help developers inspect request failures quickly inside Chrome, without turning debugging into a heavy or noisy workflow.
FAQ
What is API Error Debugger?
API Error Debugger is a Chrome extension that helps you detect, group, and inspect failing API requests directly from browser traffic.
Can it help debug 401 Unauthorized errors?
Yes. It helps surface common authentication issues such as expired tokens, missing Authorization headers, invalid credentials, and broken login flows.
Can it help with 403 Forbidden errors?
Yes. It helps you spot authorization failures and understand when access is denied because of missing permissions, invalid auth state, or restricted resources.
Why use this instead of only Chrome DevTools?
DevTools is powerful, but it can be noisy for repeated request failures. API Error Debugger gives you a cleaner and more structured view of what is failing most often.
Who is this extension for?
It is built for frontend developers, QA engineers, full-stack developers, and anyone who debugs browser API requests in Chrome.
Stop digging through DevTools
Install API Error Debugger and see failing API requests, auth issues, and network errors in a faster, cleaner, more structured way.
Install Extension